Is DFW a Buyer’s or Seller’s Market? 2026 Numbers
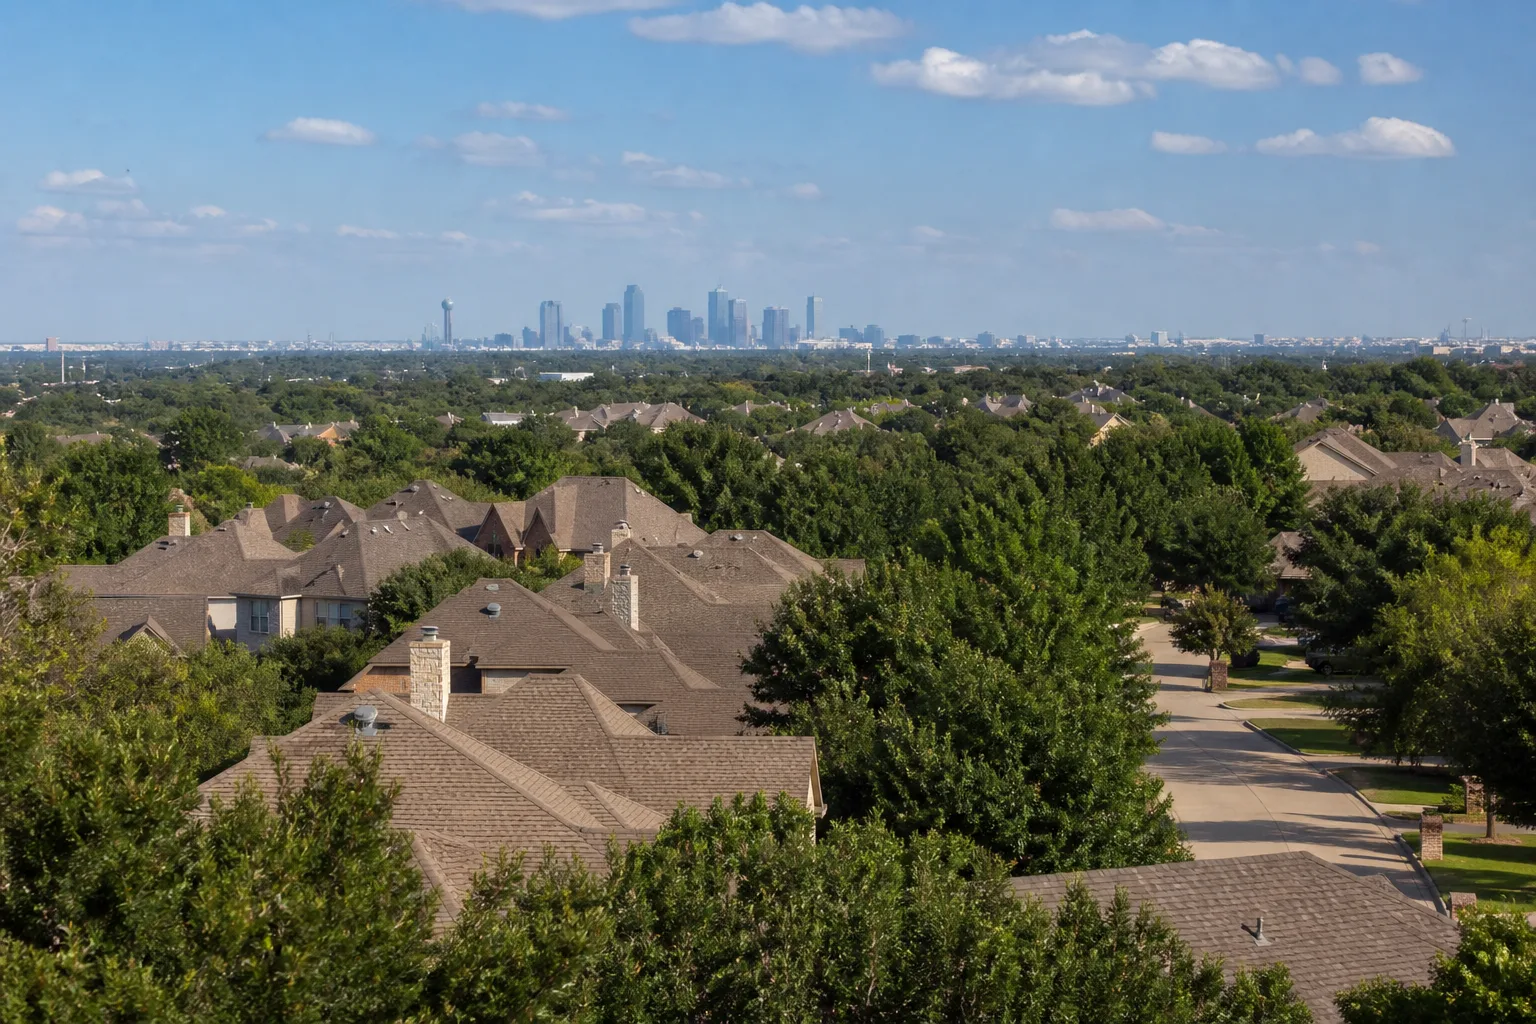
There's no single answer for all of DFW.
That's because DFW isn't one housing market. It's dozens of smaller markets stacked together.
Dallas, Fort Worth, Plano, Frisco, McKinney, and every suburb between them each has its own supply and demand. A $300,000 home in one suburb can be in a seller's market.
A $700,000 home twenty miles away can sit for months. Metro-wide, DFW was balanced in August 2026, at 4.4 months of supply.
This post gives you the three numbers behind that. They are how much is for sale, how fast it's selling, and whether homes go for full price.
Check those for your area and price range, and you'll know where you stand.
What actually tells you if it's a buyer's or seller's market?
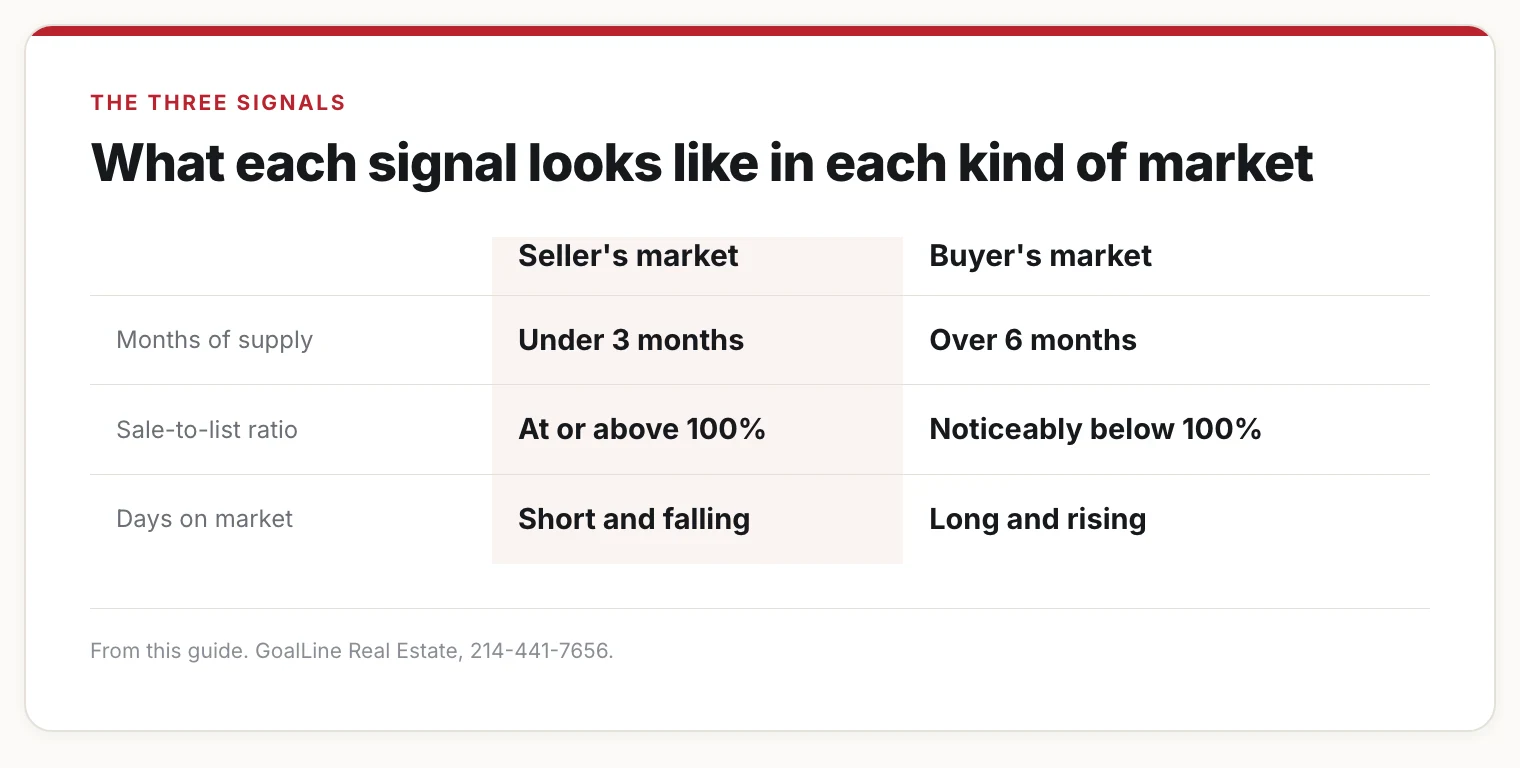
Three numbers decide who has the power in any housing market. They are how much is for sale, how fast it's selling, and whether sellers get full price.
Real estate agents call these supply, days on market, and the sale-to-list ratio. The sale-to-list ratio is the percentage of the asking price a home actually sells for.
When supply is low, homes sell fast. Sellers get full price or more.
That's a seller's market. Sellers can hold firm on price.
Buyers are competing for a small pool of homes.
When supply is high, homes sit for weeks or months. Sellers cut their price to get a deal done.
That's a buyer's market. Buyers can negotiate.
Sellers are competing for a smaller pool of buyers.
Most of the time, DFW sits somewhere between those two extremes. The exact spot depends on the price range and suburb you're looking at.
How much housing supply does DFW have right now?
Supply is measured in months. It's the clearest sign of who's in control.
Months of supply means how long it would take to sell every home currently listed. It's measured at the pace homes are selling right now.
Agents generally treat under 3 months of supply as a seller's market. 3 to 6 months is balanced.
Over 6 months is a buyer's market.
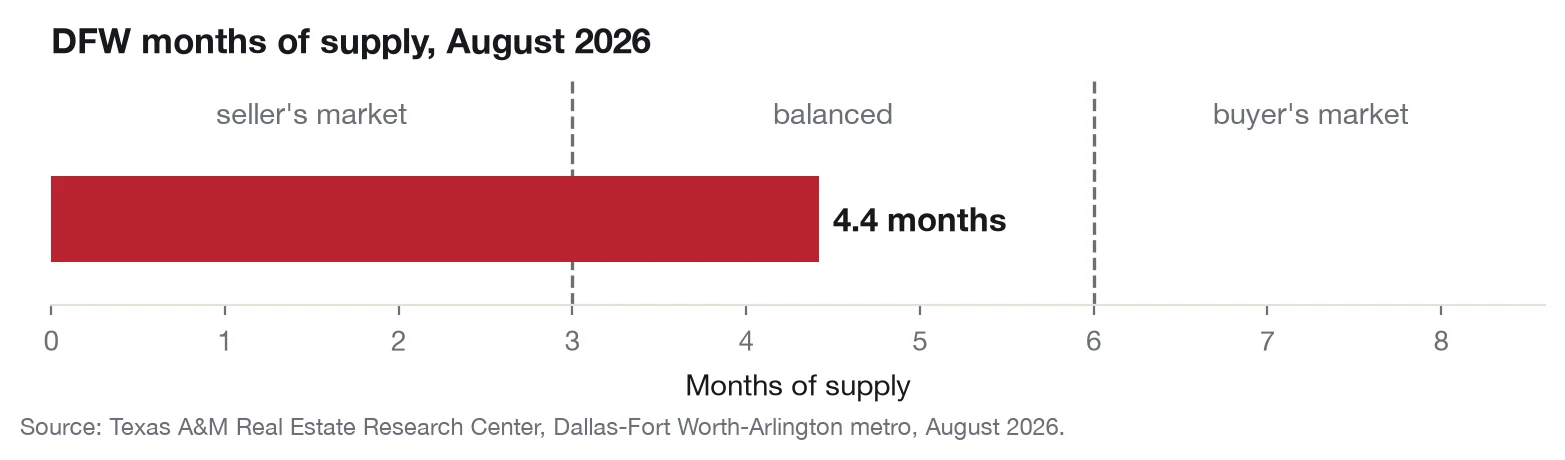
As of August 2026, the DFW metro area sat at 4.4 months of supply. That is inside the balanced band, not a buyer's market and not a seller's market.
It was down about 0.3 months from a year earlier. (Texas A&M Real Estate Research Center, Dallas-Fort Worth-Arlington, August 2026, the most recent month published.)
That number moves throughout the year. Supply usually climbs through spring and summer as more sellers list.
It drops in winter, when fewer homes come on the market.
Are DFW sellers getting full price or cutting to sell?
The sale-to-list ratio shows you who has leverage.
A ratio at or above 100% means homes sell at or above the asking price. That's a strong sign for sellers.
A ratio noticeably below 100% means buyers are negotiating sellers down. That's a strong sign for buyers.
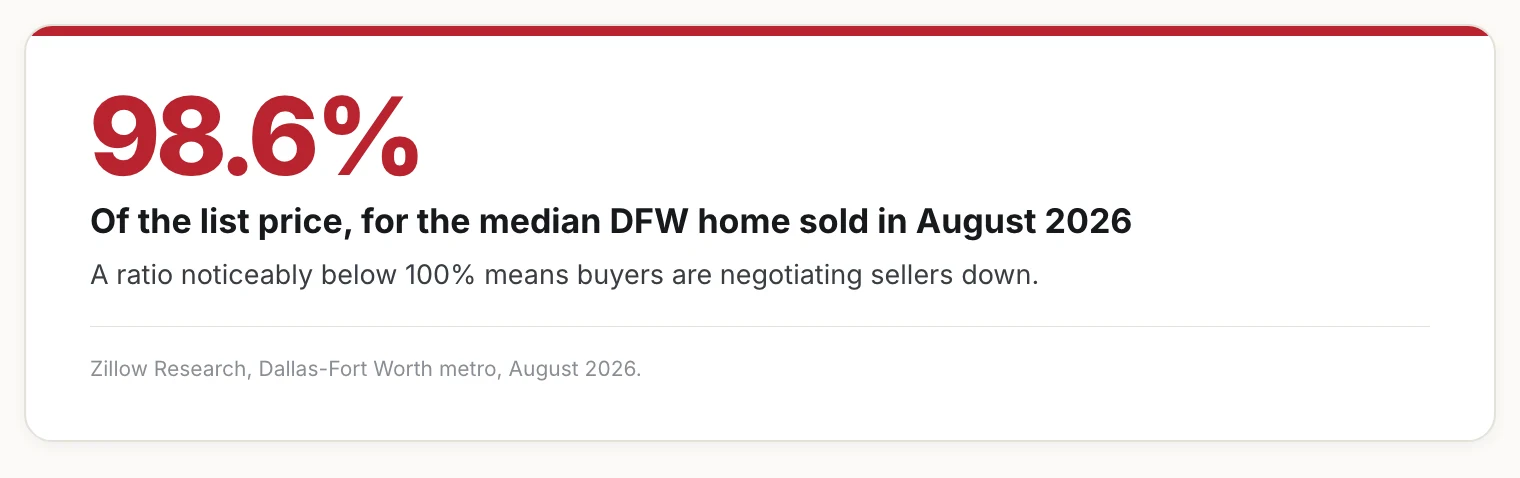
In August 2026, the median DFW home sold for about 98.6% of its list price, and about 16.3% of homes sold above list. In September, about 33.5% of listings had taken a price cut.
That combination still gives buyers some negotiating room, a little less than a year earlier. (Zillow Research, Dallas-Fort Worth metro, August and September 2026.)
Price cuts tell the same story a different way. A high share of active listings with a price cut usually means sellers overpriced.
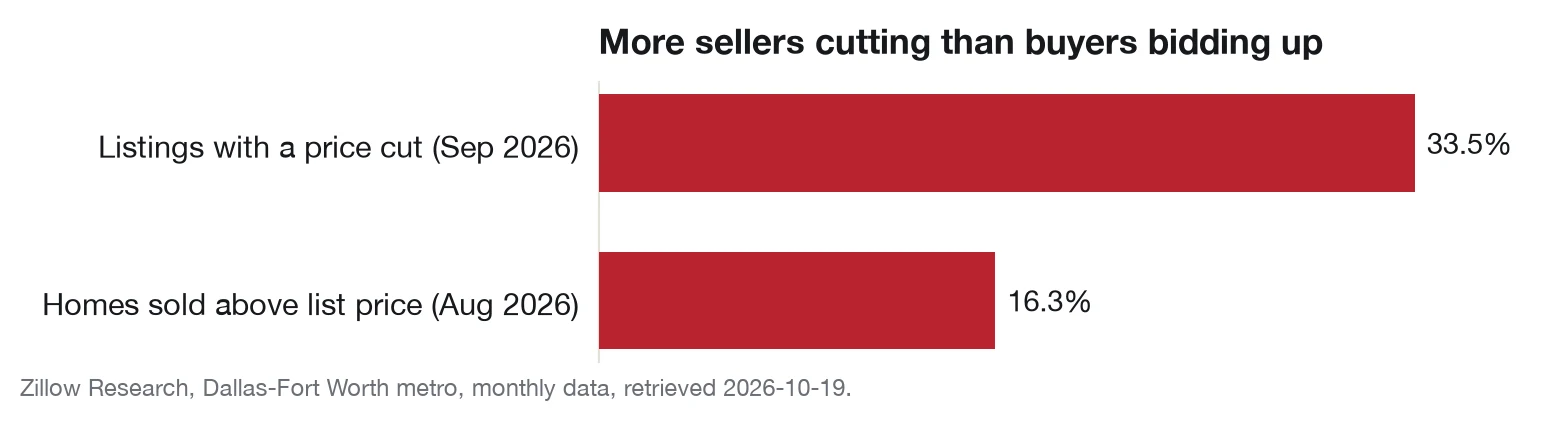
The share with a price cut was slightly higher than a year earlier, at 32.8% in September 2025.
How long are DFW homes sitting before they sell?
Days on market, or DOM, is how long a house has been listed before it sells. A rising number favors buyers.
When DOM is short, homes are moving fast. Buyers have to act quickly or lose out.
When DOM stretches out, buyers get more room. They can negotiate on price, repairs, and closing costs.
In September 2026, the median DFW home went under contract 41 days after it was listed. That was about three days faster than a year earlier, so the pace has tightened slightly rather than slowed. (Zillow Research, Dallas-Fort Worth metro, September 2026.)
Watch the trend over a few months. Don't just look at the current number.
A DOM that's climbing month over month tells you more than one snapshot does.
How do you check the current numbers for your part of DFW?
You can pull all three signals yourself in a few minutes. Do it for the exact suburb and price range you care about.
Step 1. Pick your specific area and price range.
DFW-wide numbers can hide what's happening in your target suburb. Narrow your search to the city and price range you're actually shopping in.
Do this before you look at any data.
Step 2. Check current supply and days on market.
The Texas A&M Real Estate Research Center publishes monthly sales, prices, and months of supply from local MLS data, by metro, county, and local market. Zillow Research covers the sale-to-list ratio and how fast homes go under contract, and Realtor.com's research data covers listing inventory.
Step 3. Check the sale-to-list ratio for recent closings.
This tells you whether homes near you are closing at, above, or below asking price. That's the clearest read on your negotiating room.
Step 4. Talk to someone who watches your specific suburb every week.
Metro-wide data is a starting point, not the final word. A local agent can tell you what's happening on the specific streets you're considering, right now.
The numbers
| Signal | What it means | DFW metro, latest month | Where to check |
|---|---|---|---|
| Months of supply | Under 3 = seller's market, 3-6 = balanced, over 6 = buyer's market | 4.41 months (balanced), August 2026 | Texas A&M Real Estate Research Center |
| Median sale-to-list ratio | At/above 100% favors sellers, below 100% favors buyers | 98.6%, August 2026 | Zillow Research |
| Median days to go under contract | Rising favors buyers, falling favors sellers | 41 days, about 3 days faster than a year earlier, September 2026 | Zillow Research |
| Share of listings with a price cut | A higher share signals a shift toward buyers | 33.5%, slightly higher than a year earlier, September 2026 | Zillow Research |
| Share of homes sold above list | A higher share signals a shift toward sellers | 16.3%, August 2026 | Zillow Research |
| Median sale price | Direction of prices, not of leverage | $389,000, up about 0.7% from a year earlier, August 2026 | Texas A&M Real Estate Research Center |
All figures above are for the Dallas-Fort Worth metro area, each from the most recent month its source had published as of October 19, 2026: August 2026 for supply, sale price, the sale-to-list ratio, and homes sold above list, and September 2026 for price cuts and days to go under contract. Your own city and price range can look very different from the metro as a whole.
Beth's take
This is the most inventory the DFW metroplex has experienced since 2013. At the end of last week, there were over 35,000 homes for sale in DFW.
— Beth Brake, 2026-08-07
Keep reading
- Where you should buy right now: why the market depends on where you look
- When is the best time to buy a home in DFW?
- How to win as a buyer without overpaying
- What you can actually afford in DFW right now
Market conditions change fast, and they change differently in every DFW suburb. If you want a read on what's happening in the specific area and price range you're looking at, talk to the team.
Thinking about a move?
Search every home for sale in DFW, or talk to a real person about your plans.